← Back to home
Project
🌊 Flood Risk Command Center
A live flash-flood forecasting system for a 100-acre family holding in Rajanpur, Punjab, built on the same method the WMO uses for ungauged catchments: instead of asking how much rain is coming, it asks how much rain it would actually take to flood.
JavaScript
Open-Meteo API
Copernicus DEM
Esri World Imagery
PDMA Punjab Flood Stages
WMO Flash Flood Guidance
The problem
Our family farm sits below the Suleiman Range, where mountain torrents can flood the fields with almost no warning. There is no sensor on this river and no official alert system, so we have lost crops to floods we never saw coming. A normal weather forecast does not help: knowing rain is coming is not the same as knowing whether the ground can hold it.
The approach
So I built a system that asks a better question than any weather app does. It maps the 10,472 km² catchment from satellite elevation data, splits it into six zones by how long rainfall takes to reach the farm, and tracks how saturated the ground already is, using the same method (the SCS Curve Number) the WMO recommends for rivers with no gauges. Not how much rain is coming, but how much it would take to flood us today.
The result
Now we know a flood is coming before it happens, not after the water is at the door. Tested against 11 real floods from our farm's history, it called 10 correctly with zero false alarms, and the one miss is shown openly on the page. Live satellite overlays show which fields will flood first. What used to be a guessing game is now a warning we can act on.
Screenshots
All screenshots below are of the live dashboard pulling real forecast, elevation, and satellite data at the time they were taken, not mockups.
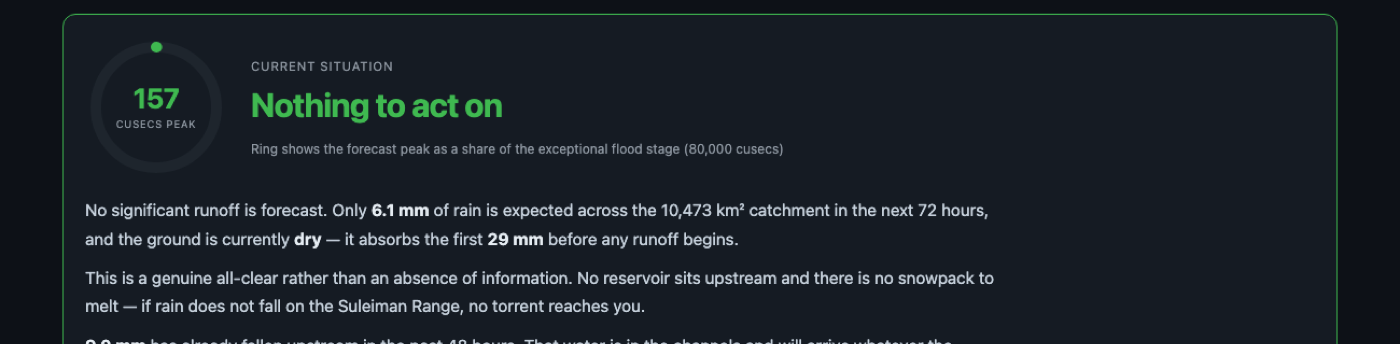
The headline call
A ring gauge showing the forecast peak as a share of the exceptional flood stage, plus the reasoning behind it in plain language, not just a number.
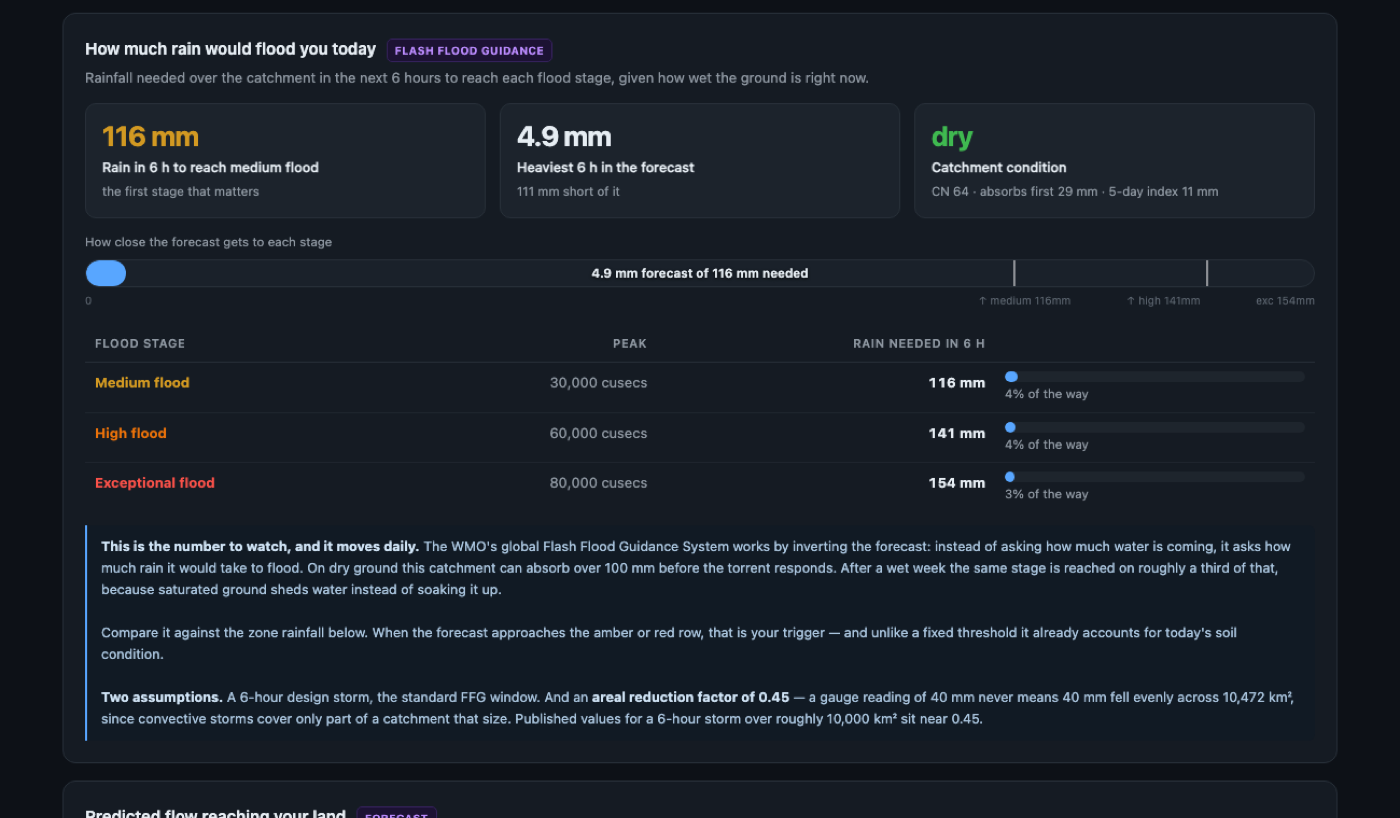
How much rain would flood you today
The WMO Flash Flood Guidance method: instead of forecasting rainfall, it calculates exactly how much rain in the next 6 hours would push the catchment to each flood stage, adjusted for how wet the ground already is.
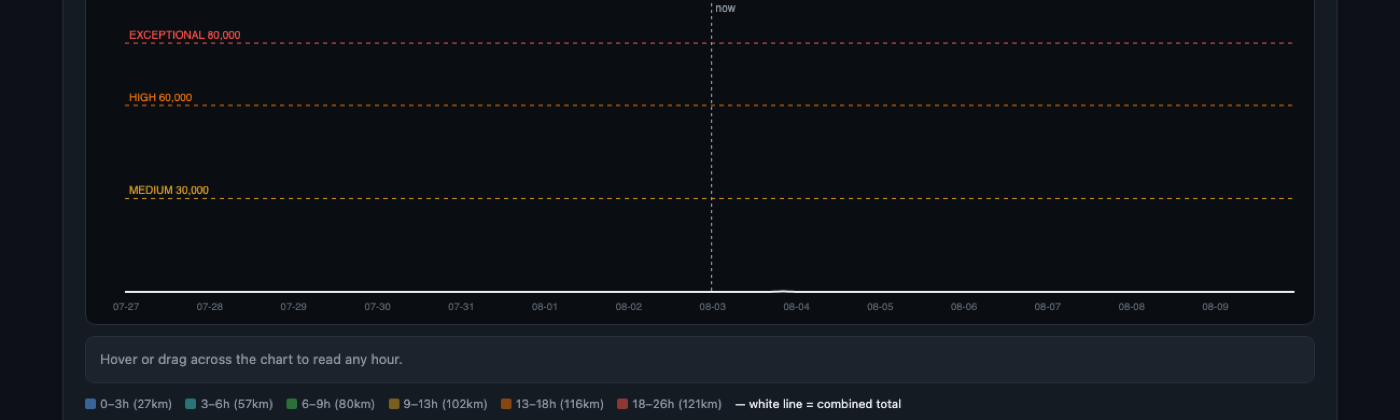
Predicted flow reaching the land
Rainfall from six upstream zones, each delayed by its own travel time then combined, plotted against Punjab's official flood stage thresholds for the Kaha torrent.
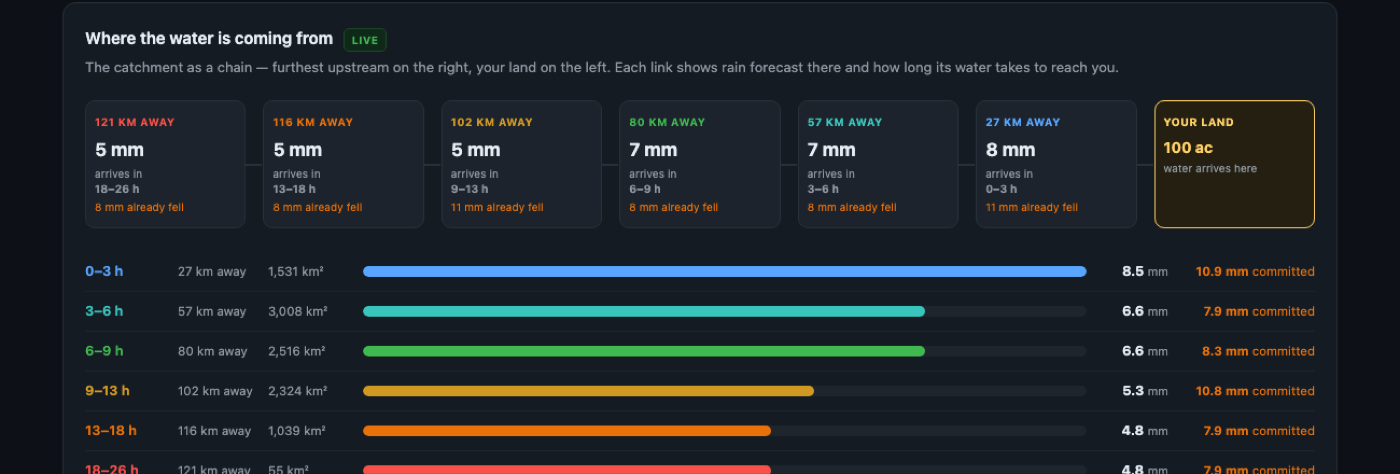
Where the water is coming from
The catchment as a chain, furthest upstream on the right, the farm on the left. Each link shows live rainfall there and how many hours its water takes to arrive.
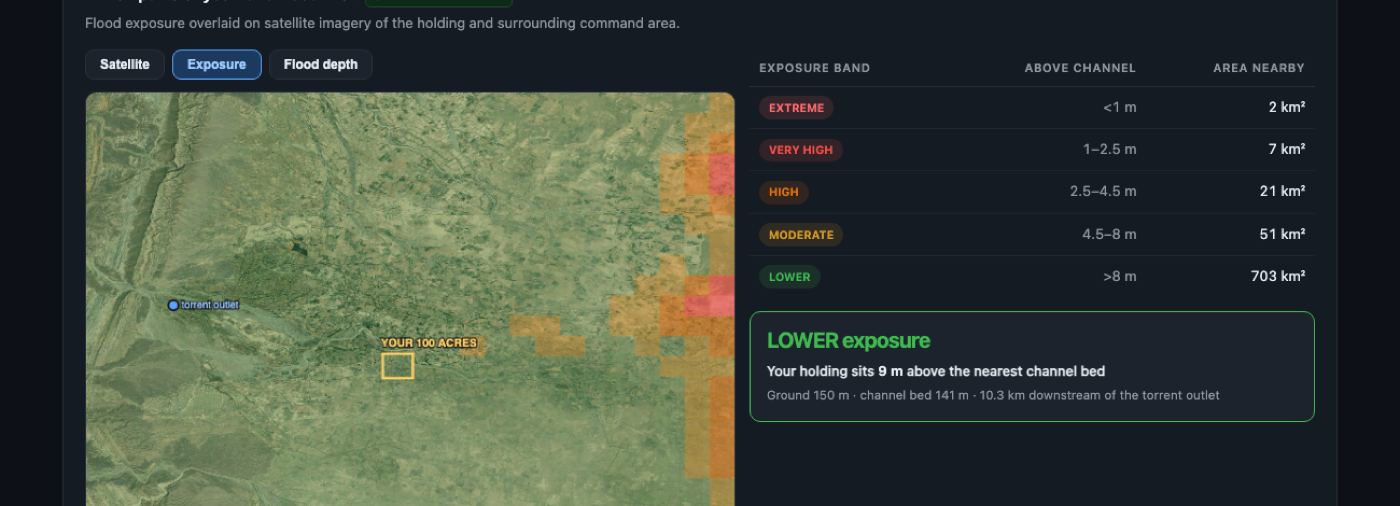
Which parts of the land flood first
Live Esri satellite imagery overlaid with a Copernicus elevation-derived exposure map, so it's clear which blocks sit low enough to flood first.
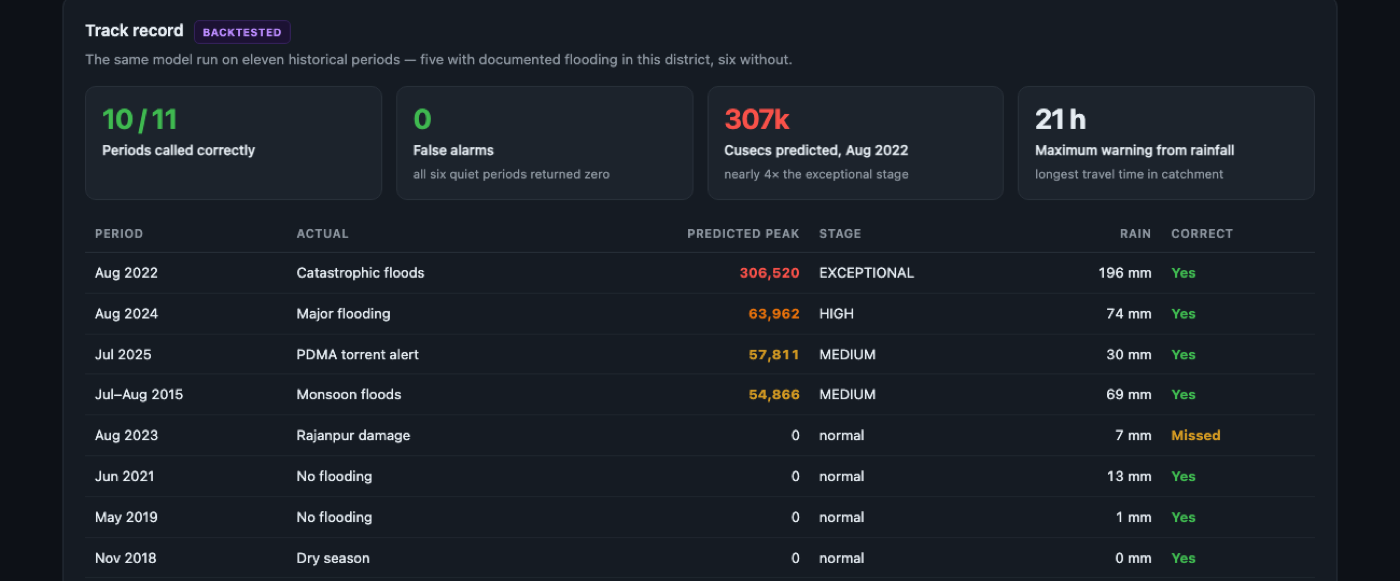
Track record, backtested
The same model run against 11 historical periods, five with documented flooding and six without. 10 of 11 called correctly, zero false alarms, and the one miss shown openly rather than excluded.
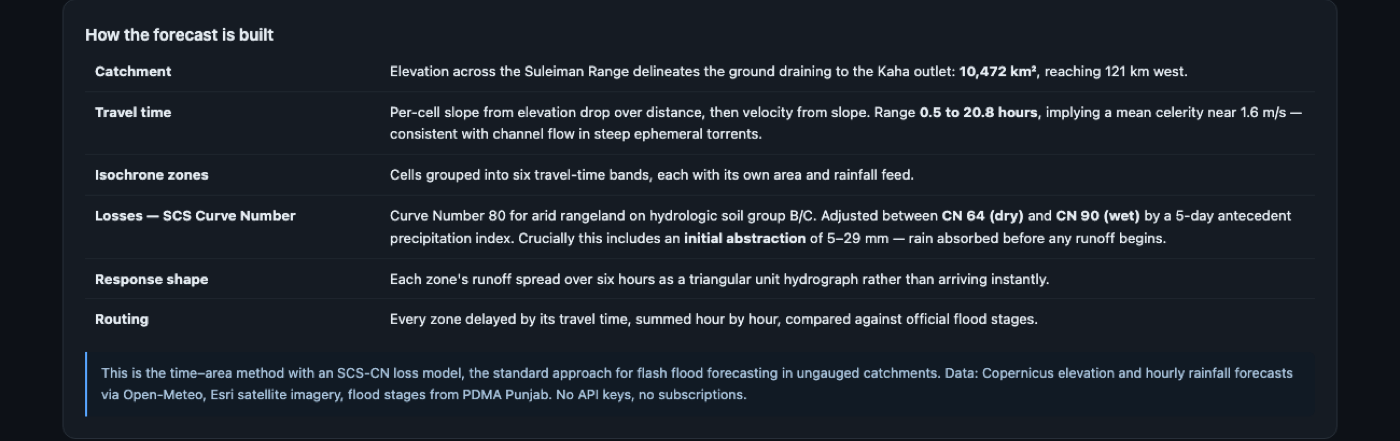
How the forecast is built
The actual hydrology underneath the dashboard: an SCS Curve Number loss model, six isochrone travel-time zones, and a triangular unit hydrograph, routed and summed hour by hour.
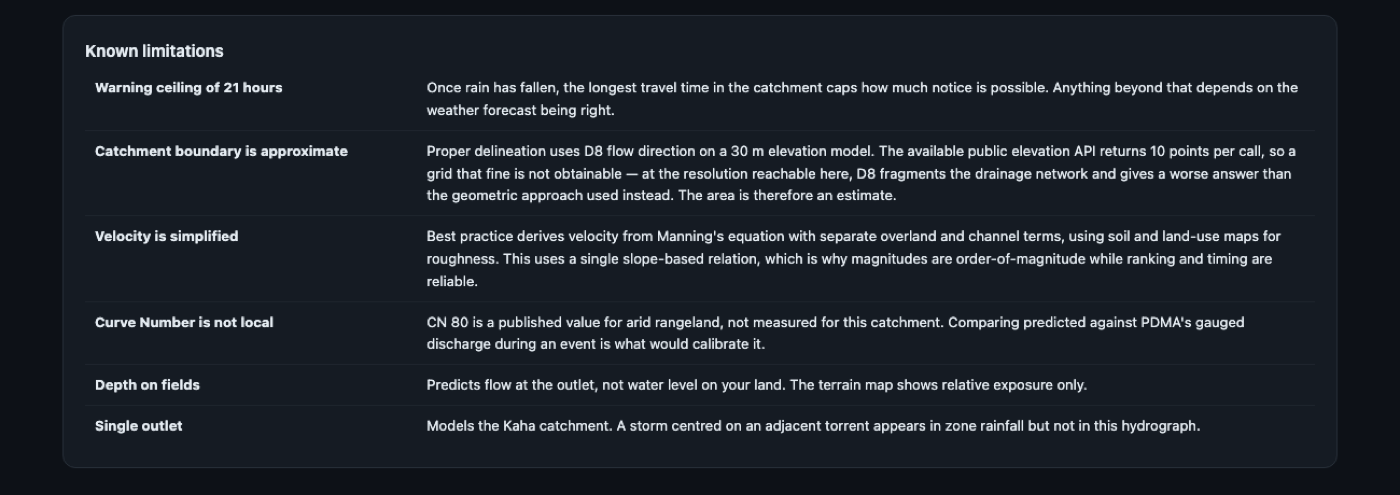
Known limitations, stated openly
Every simplification the model makes, from the 21-hour warning ceiling to why the curve number isn't locally calibrated, written in plain language instead of buried in a footnote.
▶ Watch walkthrough coming soon